The Home Run Leaders and the Batting Average Leaders
In the previous column, I wrote about the results of my research on the home run and batting average rankings of all the Run Batted In (RBIs)–leading hitters in each league since the start of modern Major League Baseball. This time, I'll present the results of my research on the batting average rankings of all the league–leading home run hitters since the start of modern Major League Baseball, and conversely, the home run rankings of all the league–leading batting average hitters.
Before showing the results in graphs, there's something I'd like to mention.
It's natural to assume that hitters who lead the league in both home runs and batting average are likely to also lead in RBIs. In other words, they have a high chance of achieving the Triple Crown. But what's the reality?
From 1901, when modern Major League Baseball began, to last year (2025), 12 players have achieved the Triple Crown a total of 14 times. However, there were 4 cases (4 times total) where a player led the league in both home runs and batting average but failed to achieve the Triple Crown because they didn't lead in RBIs.
First, just to be sure, let's list the 12 players who achieved the Triple Crown (14 times in total) by leading not only in home runs and batting average, but also in RBIs.
Nap Lajoie (1901)
Ty Cobb (1909)
Rogers Hornsby (1922, 1925)
Jimmie Foxx (1933)
Chuck Klein (1933)
Lou Gehrig (1934)
Joe Medwick (1937)
Ted Williams (1942, 1947)
Mickey Mantle (1956)
Frank Robinson (1966)
Carl Yastrzemski (1967)
Miguel Cabrera (2012)
Next, let us look at the four instances—involving four different players—where a player led the league in home runs and batting average but failed to win the Triple Crown because they did not lead in RBIs.
1) Heinie Zimmerman (1912)
2) Babe Ruth (1924)
3) Ted Williams (1941)
4) Johnny Mize (1939)

I investigated the identities of the players who actually led the league in RBIs in these four instances. The results, along with the players' respective teams, are listed below.
Home run and batting average leader RBIs leader
1) Heinie Zimmerman (Chicago Cubs) Honus Wagner (Pittsburgh Pirates)
2) Babe Ruth (New York Yankees) Goose Goslin (Washington Senators)
3) Ted Williams (Boston Red Sox) Joe DiMaggio (New York Yankees)
4) Johnny Mize (St. Louis Cardinals) Frank McCormick (Cincinnati Reds)

Do you notice anything when looking at these results? It immediately struck me, so I decided to investigate. The results confirmed my hunch: the teams featuring the league leaders in RBIs finished higher in the final standings than the teams featuring the leaders in home runs or batting average. In other words, even if a player leads the league in home runs or batting average, they might not top the RBI rankings if their team's overall performance is not good. Details are as follows.
Regular Season Standings
1) Chicago Cubs 3 2 Pittsburgh Pirates
2) New York Yankees 2 1 Washington Senators
3) Boston Red Sox 2 1 New York Yankees
4) St. Louis Cardinals 2 1 Cincinnati Reds
Here, I present graphs showing the batting average rankings of all players who led the league in home runs since the start of the modern Major League era, as well as the home run rankings of all players who led the league in batting average.
First, the batting average rankings of all players who led the league in home runs:

Next, the home run rankings of all players who led the league in batting average:

It is fair to say that the two graphs above are similar. In other words, players who lead the league in home runs tend to rank high in batting average, and players who lead the league in batting average tend to rank high in home run totals.
The following are the players who lead the league in home runs but rank 60th or lower in batting average.
Batting average ranking
Carlos Pena (2009) 75
Gorman Thomas (1979) 69
Chris Carter (2016) 66
Dave Kingman (1982) 65
Ryan Howard (2008) 61
Darrell Evans (1985) 60
Kyle Schwarber (2025) 60
The players who lead the league in batting average but have zero home runs are as follows:
Ginger Beaumont (1902)
Zack Wheat (1918)
Rod Carew (1972)
Finally, I would like to add a few points regarding the two graphs mentioned above.
While those graphs summarize results spanning the entire modern Major League era—from 1901 through 2025—I also created a set of graphs that break this timeframe down into three distinct periods: the "Dead–ball Era" (1901–1919), when balls did not travel as far; the subsequent period from 1920 to 2000; and the 21st century (2001–2025), marked by the "Fly Ball Revolution" and a rise in players aiming for home runs.
First, let us look at the batting average rankings of the players who led the league in home runs.

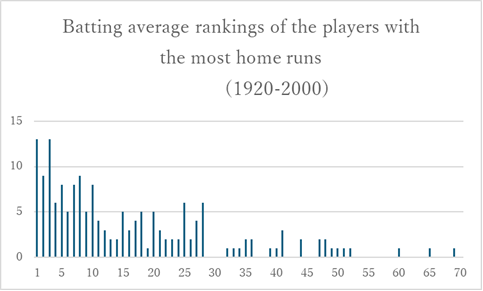

Looking at the graph divided into the three periods above, we can say the following: In the "Dead–ball Era" and the 21st century, players with the most home runs in the league tend to also rank high in batting average, but this trend is not as clear as in the 1920–2000 period, and players tend to be scattered evenly across various batting average rankings. Why is that? In the "Dead–ball Era", the ball didn't travel far, so no one could hit many home runs regardless of their batting average ranking, which may have weakened the relationship with batting average ranking. In the 21st century, everyone started hitting a lot of home runs, which may have weakened the relationship with batting average ranking.
Next, let us look at the home run rankings of the players who led the league in batting average.


I think the same thing can be said about these three graphs as about the three graphs showing the batting average rankings of the league's top home run hitters.
(If I've made a mistake or left out something important, please let me know. I'll try to make corrections or additions.)